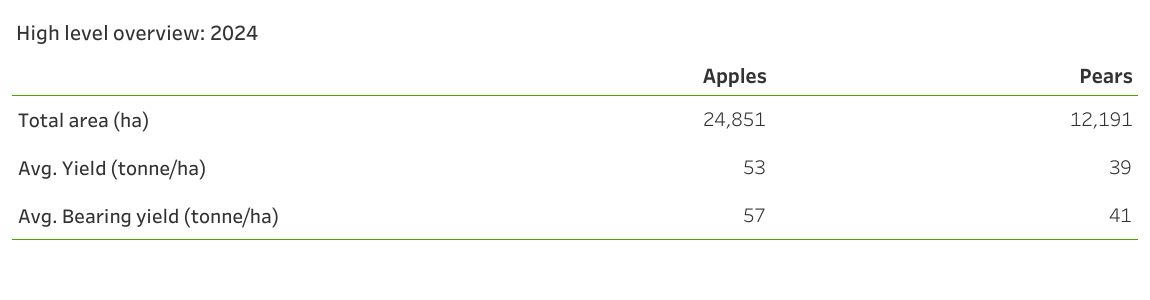
Pome Fruit Key Summary Statistics
Summary Statistics
Production area and yield
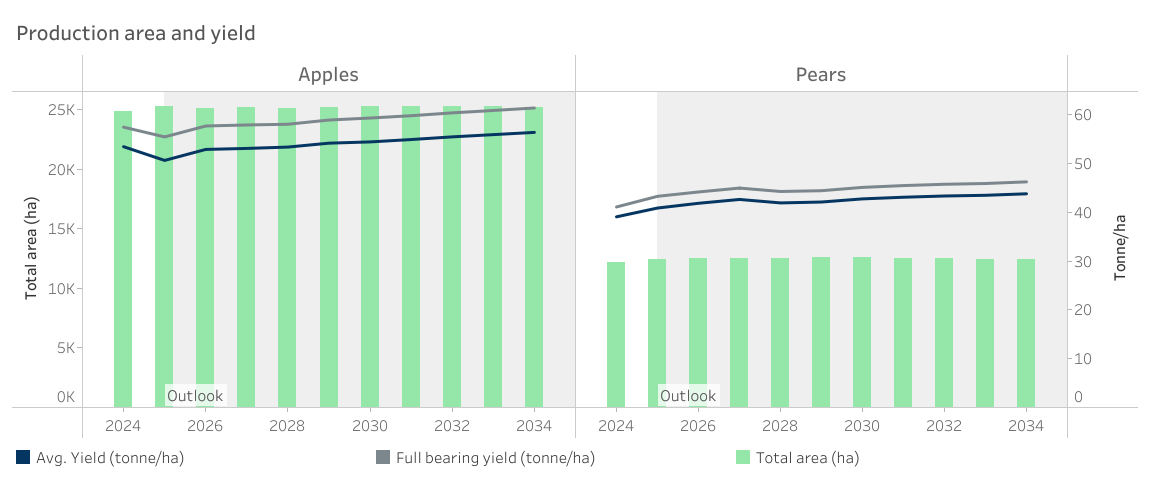
Whilst apple area fluctuated between 25 000 and 25 500 hectares since 2020, the projection over the outlook maintaining this balance. Area for pears peaked in 2020 at 12 925, with a marginal reduction ever since, which is expected to balance out over the outlook period to a maintenance of about 12 500 hectares annually. These projections are driven by the changing management practices, with a strong focus on intensification to improve the number of cartons per hectare that reduces the cost carried per carton.
Bearing status
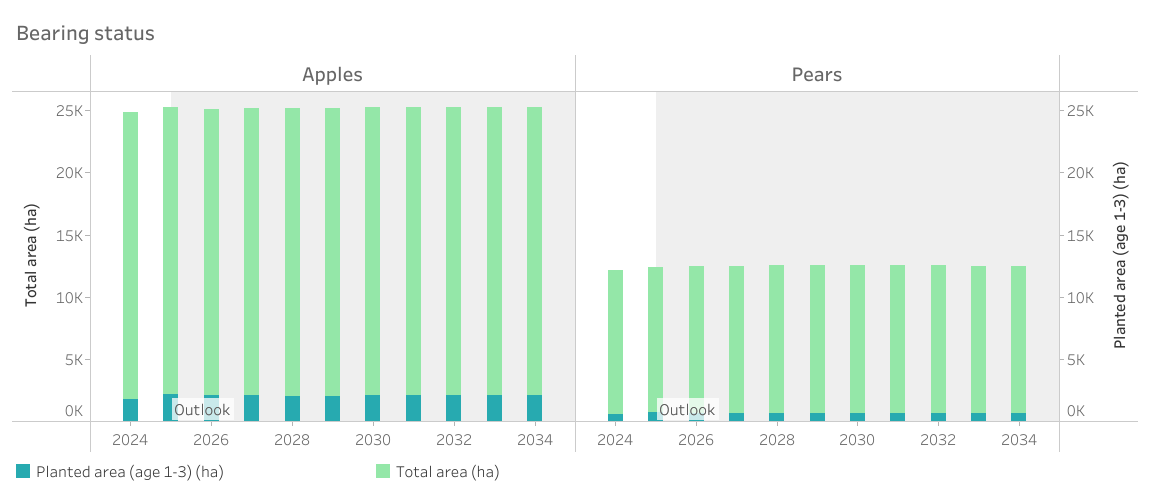
To achieve the necessary yield growth to effectively reduce the burden of inputs per carton, timely replacement of older or underperforming orchards at a sustainable rate is a key factor. In the process, the projected outlook remains fairly consistent with the recent past in terms of the ratio between non-bearing and bearing orchards, which is lower than what is was a at the end of the previous decade.
Market split
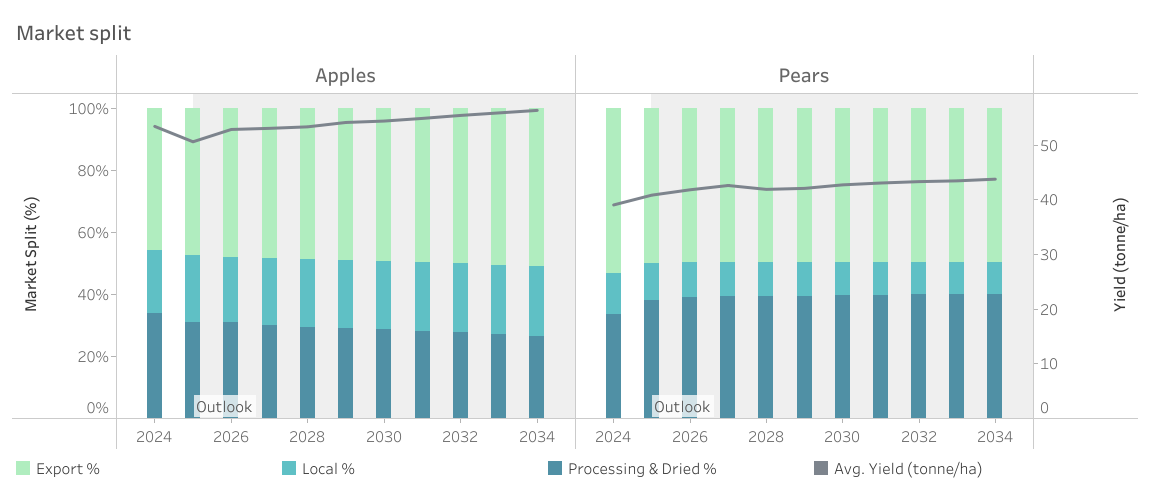
The market split for apples is projected to lean slightly more toward exports over the outlook period. With the support of anticipated yield growth, the increase in productivity means that even a modest shift in market share translates into a significant multiplication effect on export volumes, reinforcing apples’ role in South Africa’s global trade footprint. In contrast, pears are expected to see a slight shift from fresh local sales toward processing. This adjustment reflects limited growth potential in domestic consumption rather than a decline in local supply. In fact, the absolute quantity allocated to the local market is expected to remain broadly similar to historical levels. However, as total pear production rises, the share directed to processing will increase, ensuring that surplus volumes are absorbed efficiently while maintaining market balance.
Nominal and real prices
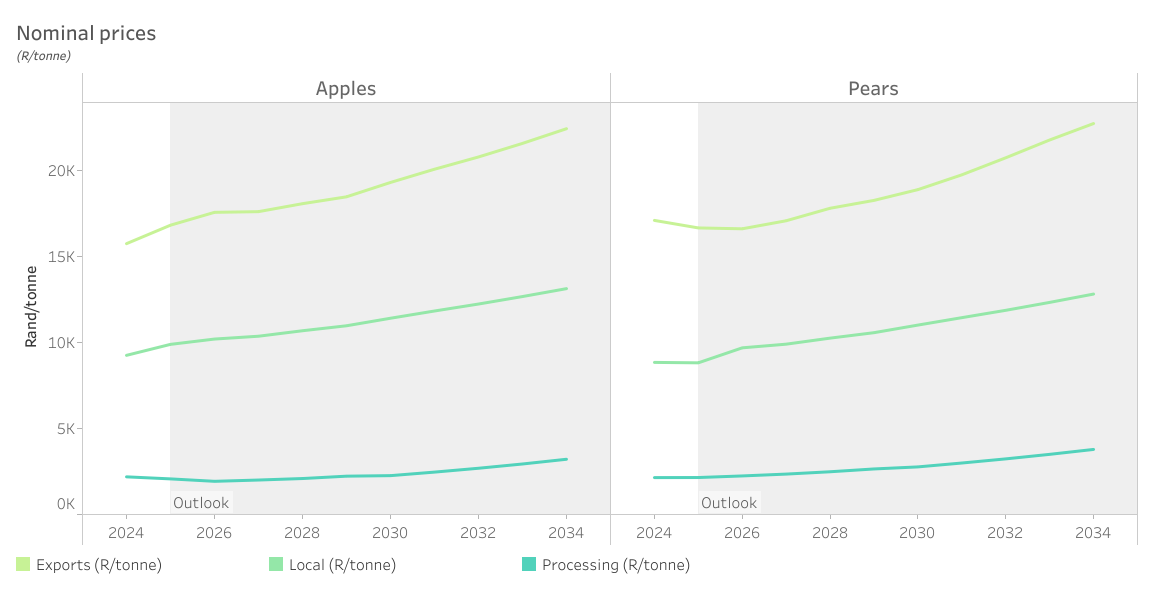
Price trends in the pome fruit industry have followed a volatile trajectory over the past few years. In 2020, the combination of a weak Rand and strong global demand during the Covid-19 period supported robust export prices. However, this was followed by constrained demand, a severe logistical crisis that disrupted supply chains and tempered price growth. By 2024, prices reached record highs in nominal terms, with real price growth evident since 2021 as markets recovered. Looking ahead, prices are expected to come under pressure in the short to medium term as the market rebalances at these elevated levels, driven by higher production volumes and competitive dynamics. Toward the end of the outlook period, prices are projected to rise again, although in real terms they will align more closely with 2021–2022 levels. This reflects the dual effect of expanding supply and persistent market pressure, underscoring the need for efficiency gains to sustain profitability.