Stone fruit farm level planning and decision making: Witzenberg
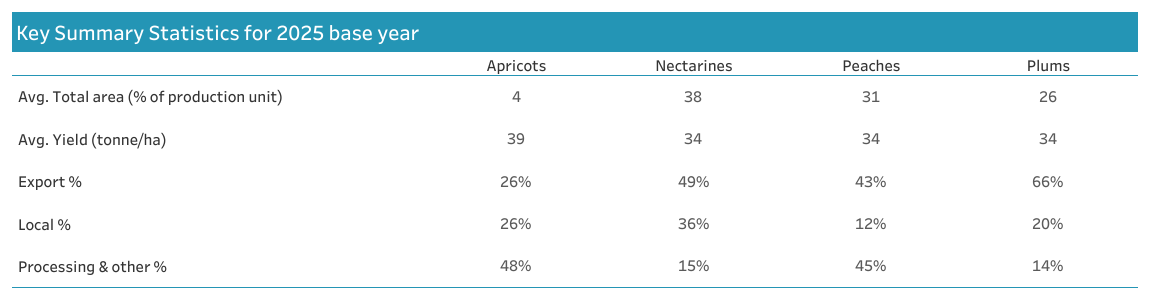
Key Summary Statistics for 2024/25 base year
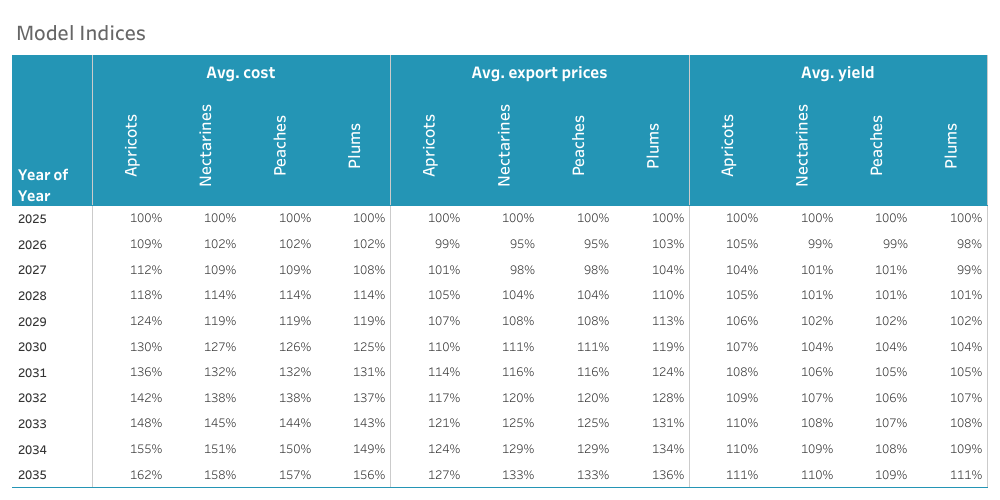
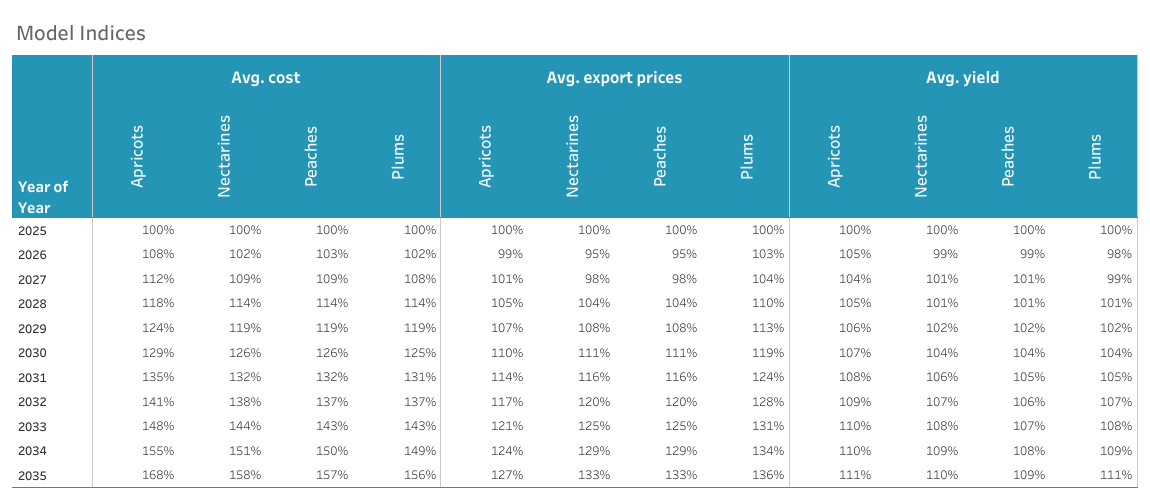
Model Indices
Market split and yield
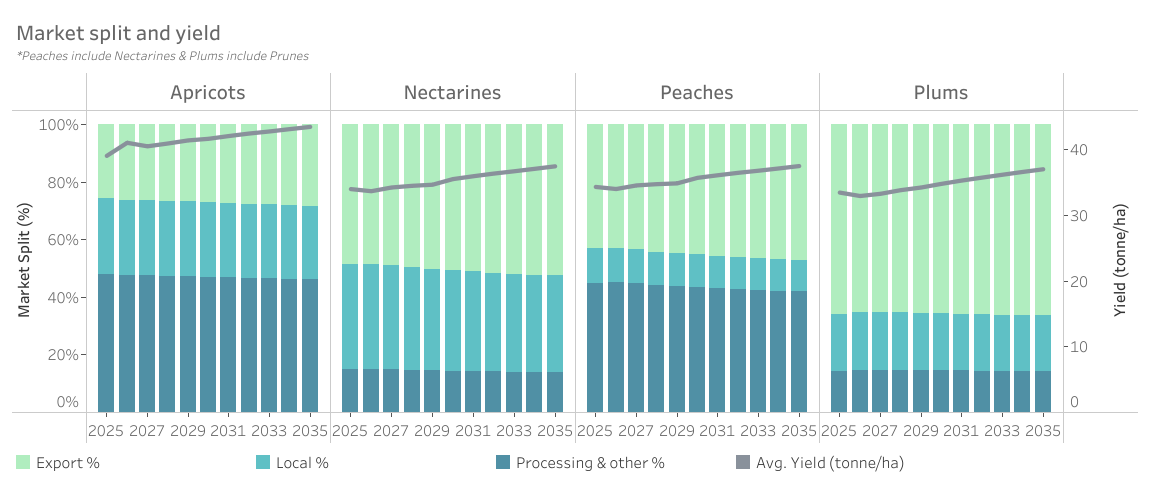
A consistent yield improvement over the outlook period is projected, barring weather related fluctuations. Whilst working towards better pack outs, both exports and fresh local sales are expected to trend upwards. With the processing market under pressure, the focus is on improving packed volumes, but a share of fruit would always need to absorbed in the processing market when not suitable for fresh sales.
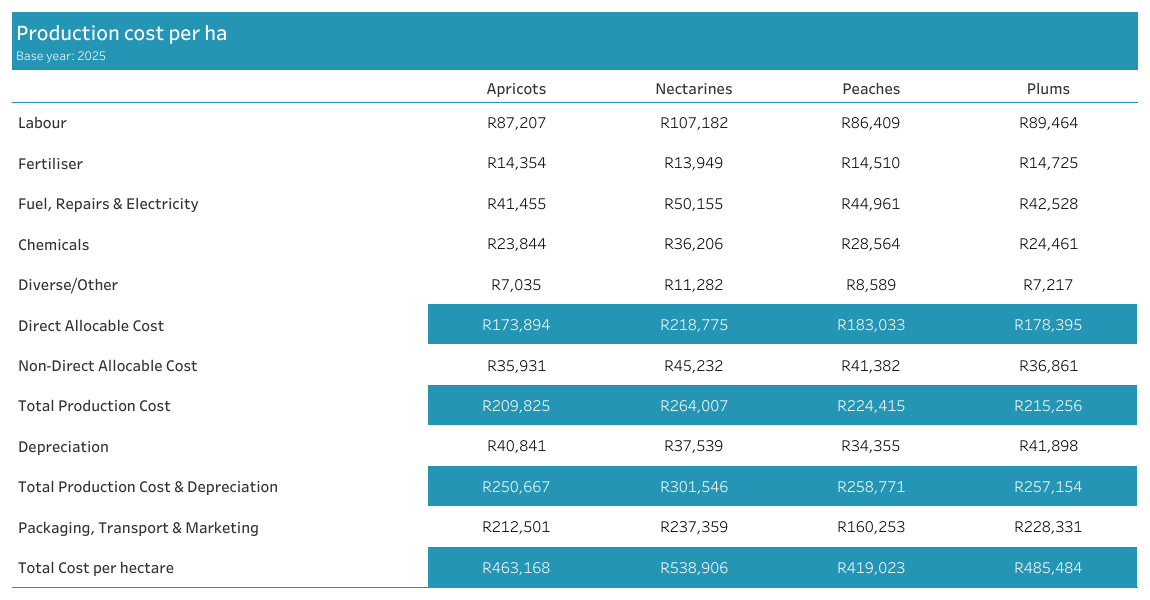
Production cost for 2024/25 base year
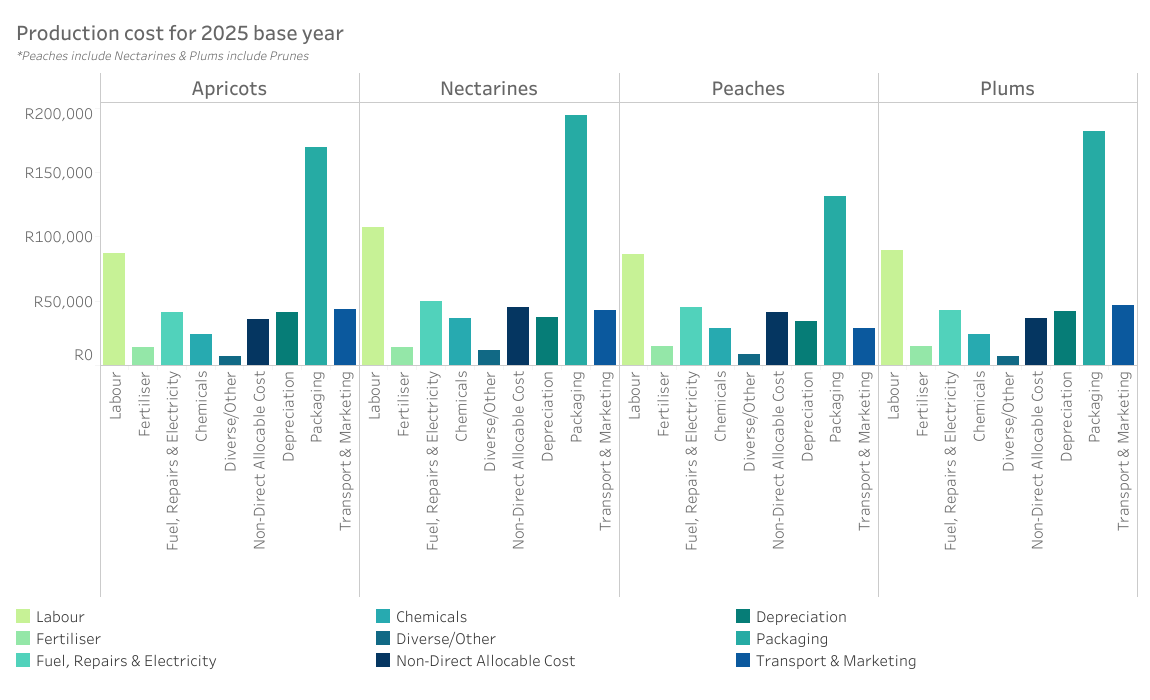
The annual cost of production on one hectare of stone fruit in this specific region is given here and is broken down to its direct and non-direct allocable cost components.
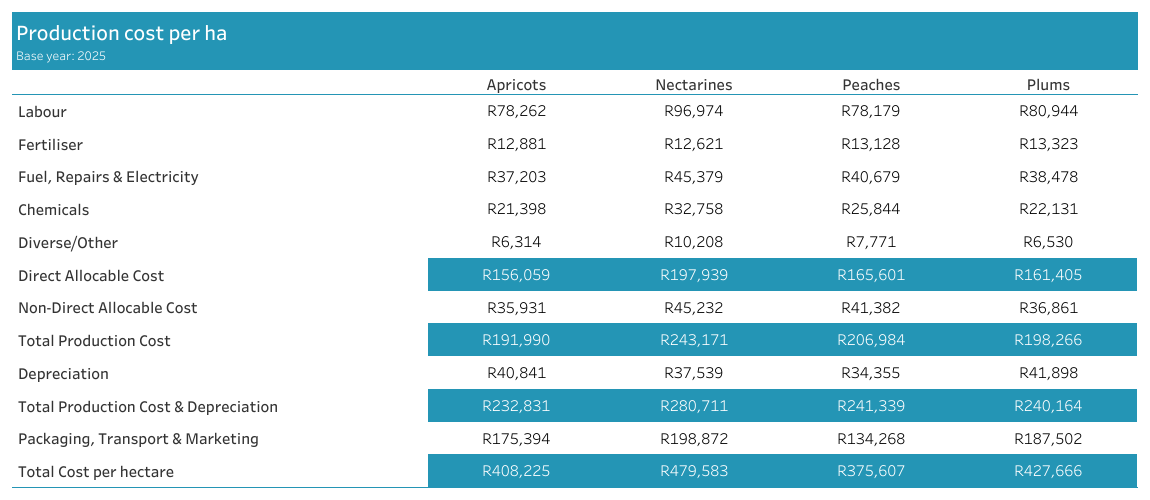
Production cost per ha (detailed)
Income
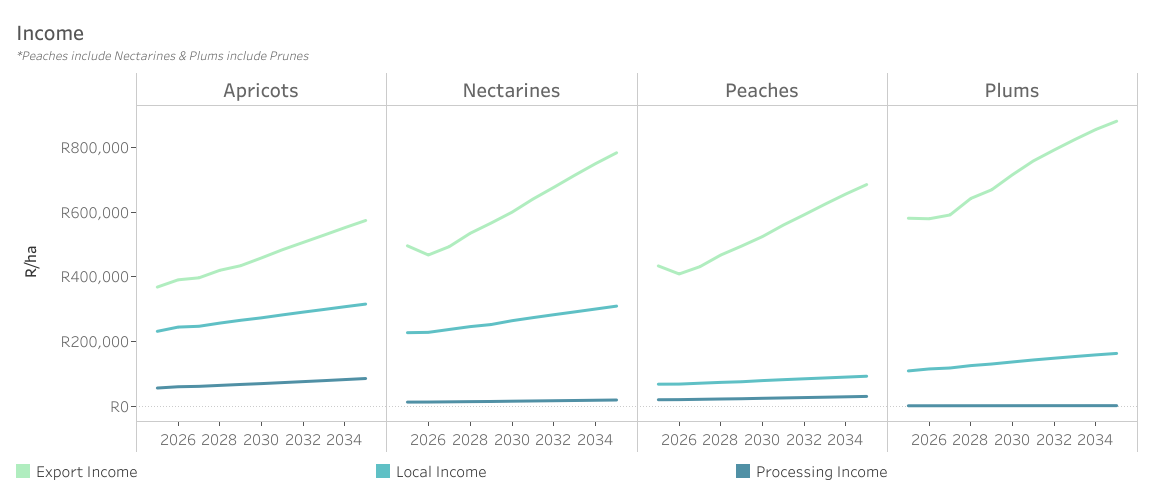
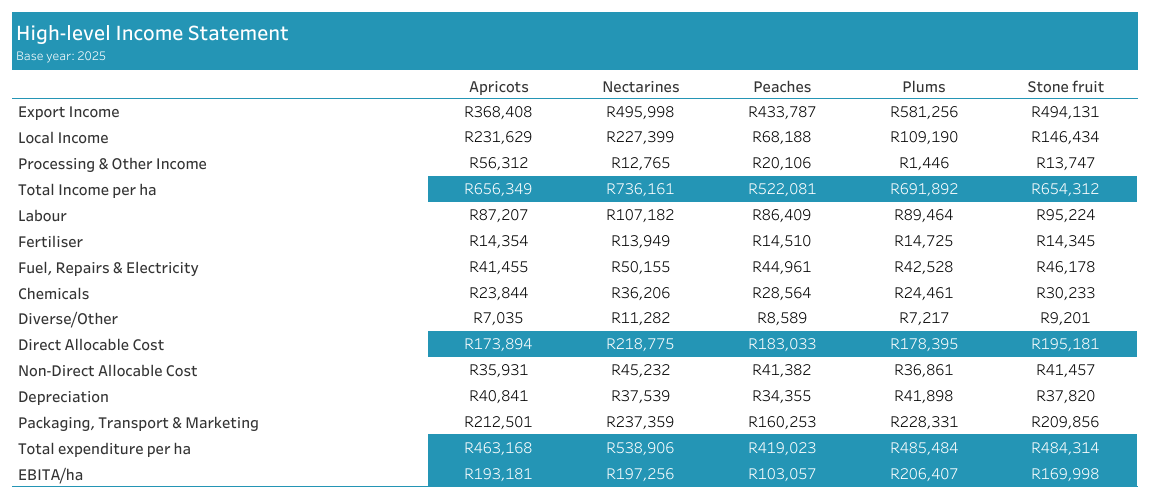
Nominal price increases projected for the industry average output prices across all market outlets (Rand/tonne), along with average yield increases over the long term, translate to increased income per hectare on farm-level. If the projections are considered for a full-bearing production unit, the higher yields then lead to higher revenue per hectare than if replacement of older orchards is done on farm-level (if assumed that the older orchards left in the ground does not deteriorate in terms of yield and marketability of the specific cultivar). Macro-economic factors such as the challenges experienced in overseas markets with regards to consumer buying power and freight cost increases, that are still higher than historic levels (pre-pandemic), are expected to put some pressure on output prices and thus farm-level revenue for the medium term (i.e., revenue per hectare will probably not be what it could have been if these factors were not present). However, the positive effects on output prices such as the weakening of the rand and improved marketing opportunities are expected to lead to improved revenue per hectare over the long term. Revenue for exports were calculated on a FOB level, and thus FOB costs are included when calculating profitability, while the revenue of domestic outlets (for fresh and processing) are calculated as the revenue received when selling to the local market (with the appropriate costs subtracted from there for profitability calculations). For farm-level revenue calculations, the regional differences were also considered in terms of yield and potential output prices. These differences originate predominantly from differences in climate, cultivars and timing in the market.
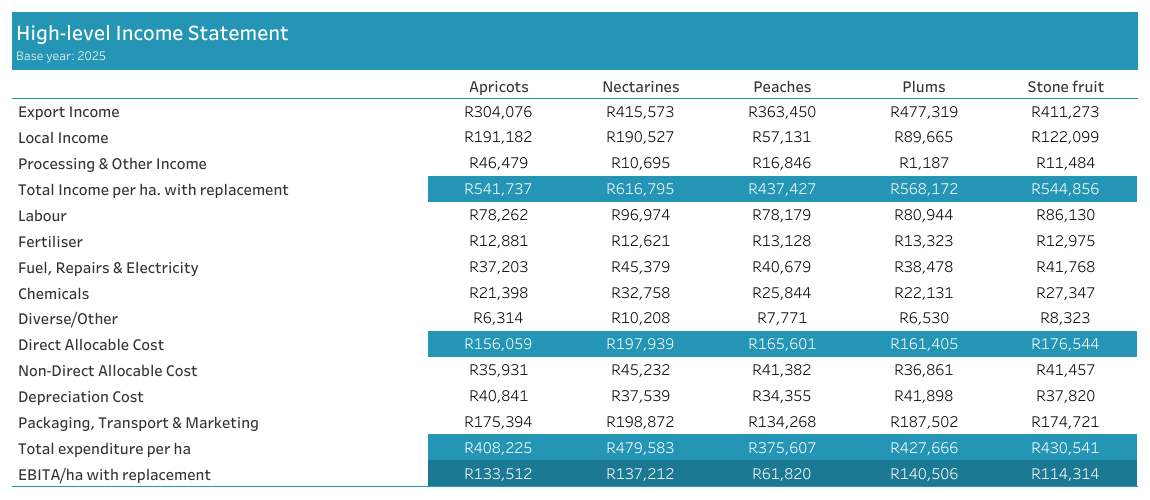
High-level Income Statement
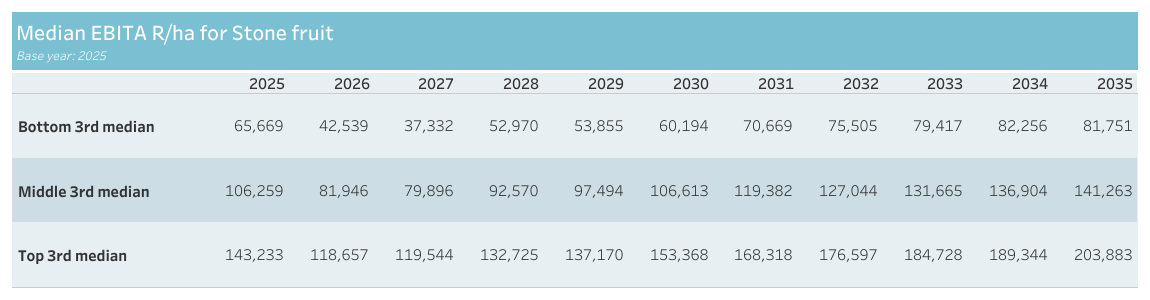
Median EBITA R/ha for Stone fruit
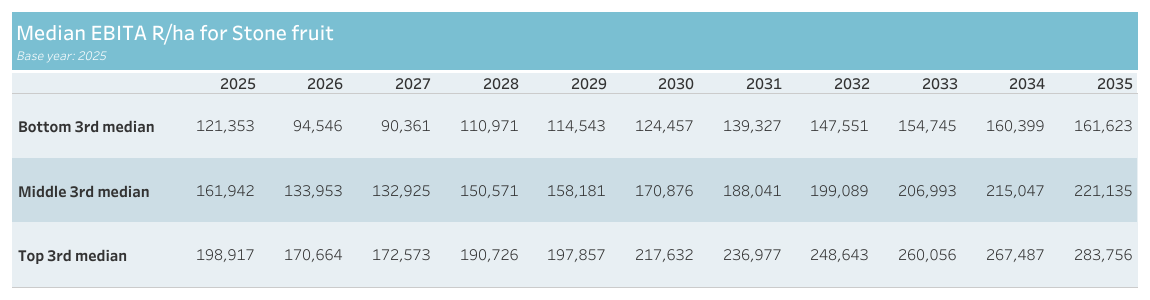
Given the cost and output assumptions of the deterministic model, certain key output variables (KOVs) are made stochastic by including randomness in the outlook of these variables, within a certain band typified by their historic values. With these stochastic variables, simulations are run of each farm model to give a 500-iteration range of probable profitability outcomes. These values correspond to the figure below at an earlier step in the process (EBITA instead of Return on Establishment Cost) and provides and a projection for the medians* of the bottom third, middle- and top third of all outcomes. The probability of negative returns projected in the figure below is strongly linked to a) the base year’s performance (yields, pack-out, prices, and relative cost of production), and b) the commodity split per region. A more diversified portfolio often has a mitigating effect in terms of the change in the average returns, but an essential component of said portfolio is a high revenue generating base. The median* bottom third remains negative or low, and fairly consistent, throughout the outlook period. In comparison, in nominal terms, an improvement in the middle third is projected over the second part of the outlook. The more pronounced improvement in the top third is indicative of a slight improvement in the overall risk profile over the outlook period. This is, in our view, congruent with the changes observed in the field where producers actively work towards reducing the impact of adverse conditions on production. *Median refers to the midpoint of a data range, which is a more measured output than the extreme points, i.e., minimum and maximum, and deemed a more appropriate calculation method in this case.
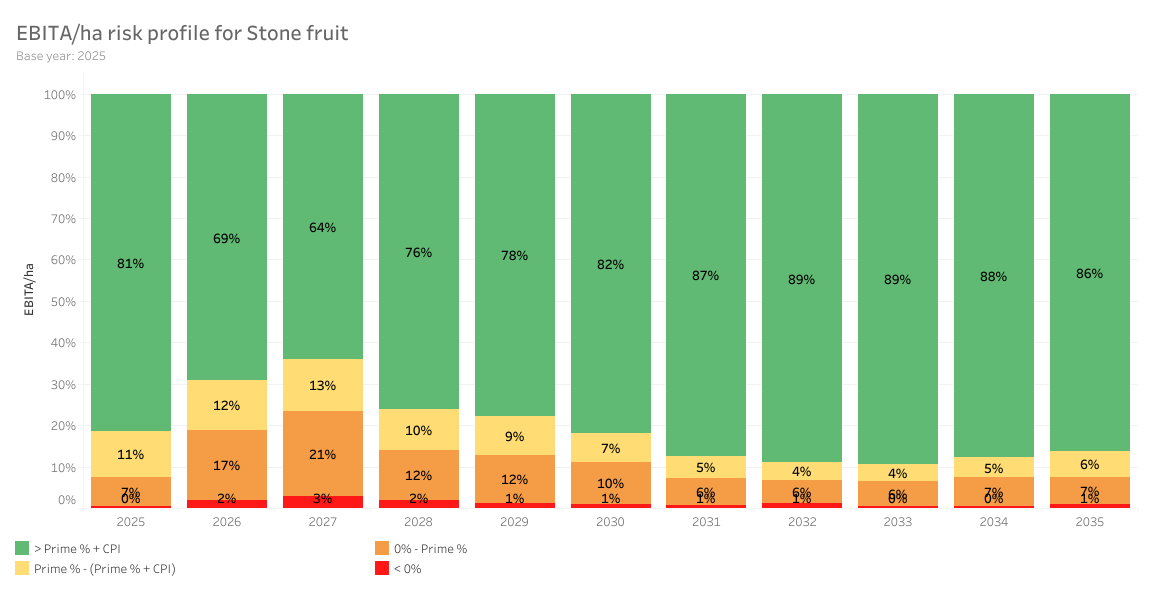
EBITA/ha risk profile for Stone fruit
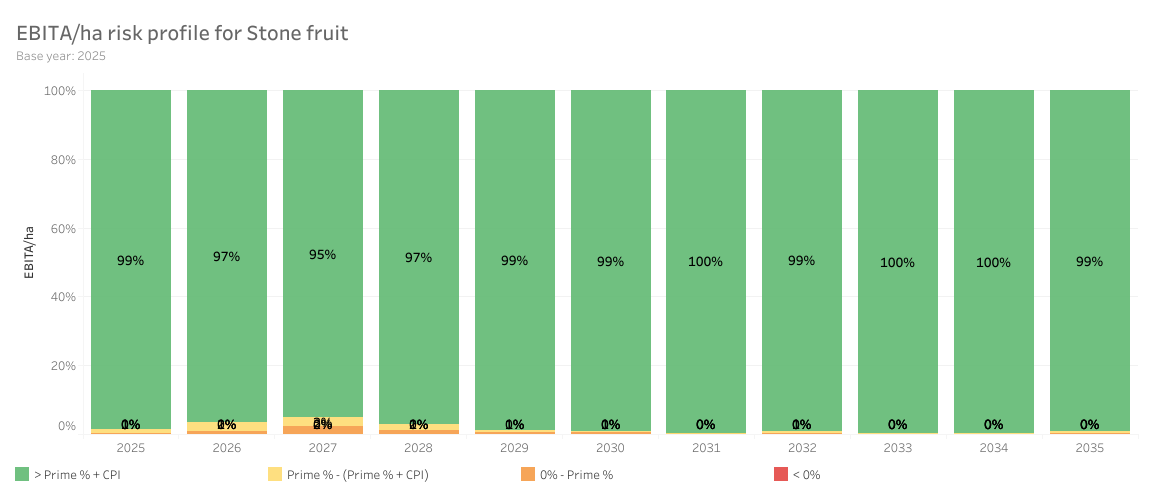
The simulated data of the stochastic models are further represented as a risk profile for the prototype, industry representative farm model in the region. The probabilities of achieving different levels of profitability are therefore given according to the legend given in the figure. The probability of negative returns in any given year remains – although it differs substantially between regions based on the factors highlighted above. With smaller, but intensive production units, stone fruit growers are dependent on higher returns per hectare to remain sustainable.
Key Summary Statistics for 2024/25 base year

Model Indices
Market split and yield
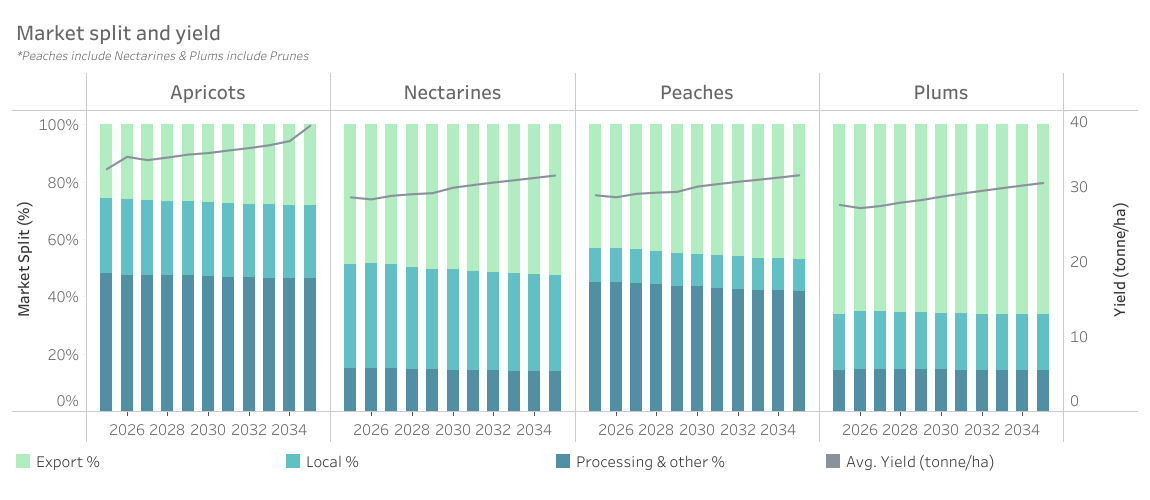
A consistent yield improvement over the outlook period is projected, barring weather related fluctuations. Whilst working towards better pack outs, both exports and fresh local sales are expected to trend upwards. With the processing market under pressure, the focus is on improving packed volumes, but a share of fruit would always need to absorbed in the processing market when not suitable for fresh sales.
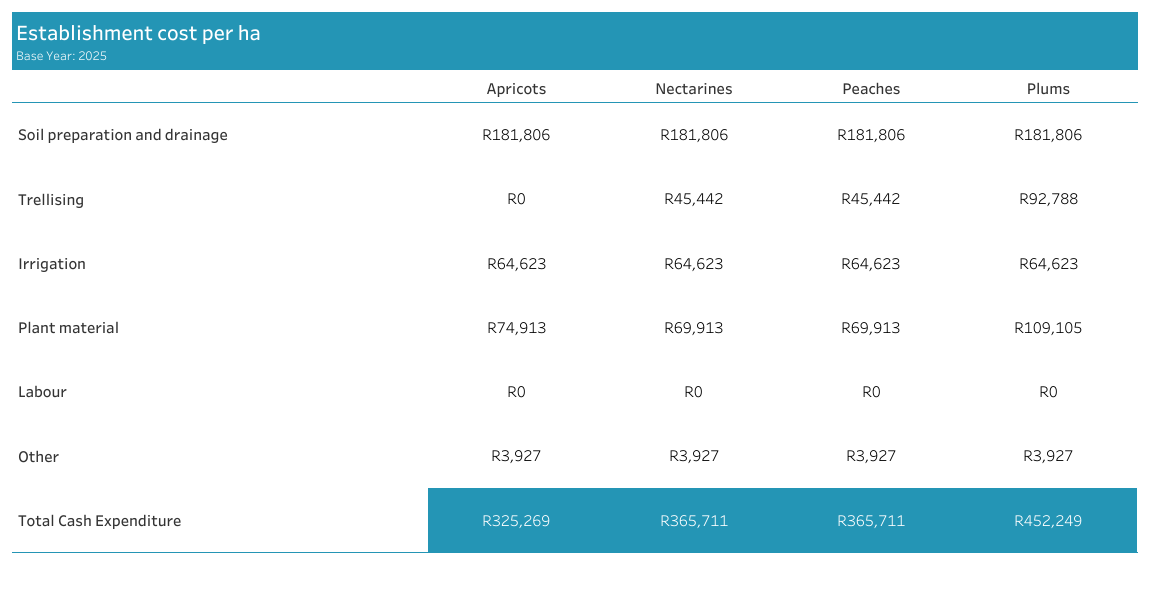
Establishment cost for 2024/25 base year
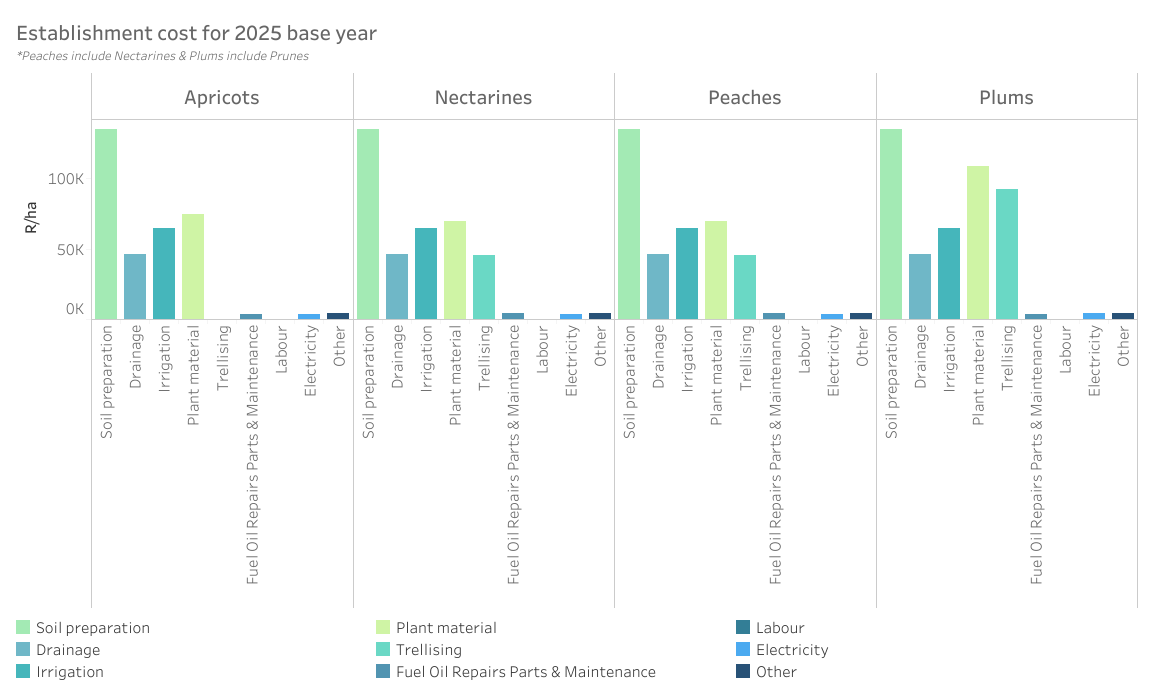
The cost of establishing one hectare of stone fruit in this specific region is given here and is broken down to its direct allocable cost components.
Establishment cost per ha (detailed)
Production cost for 2024/25 base year
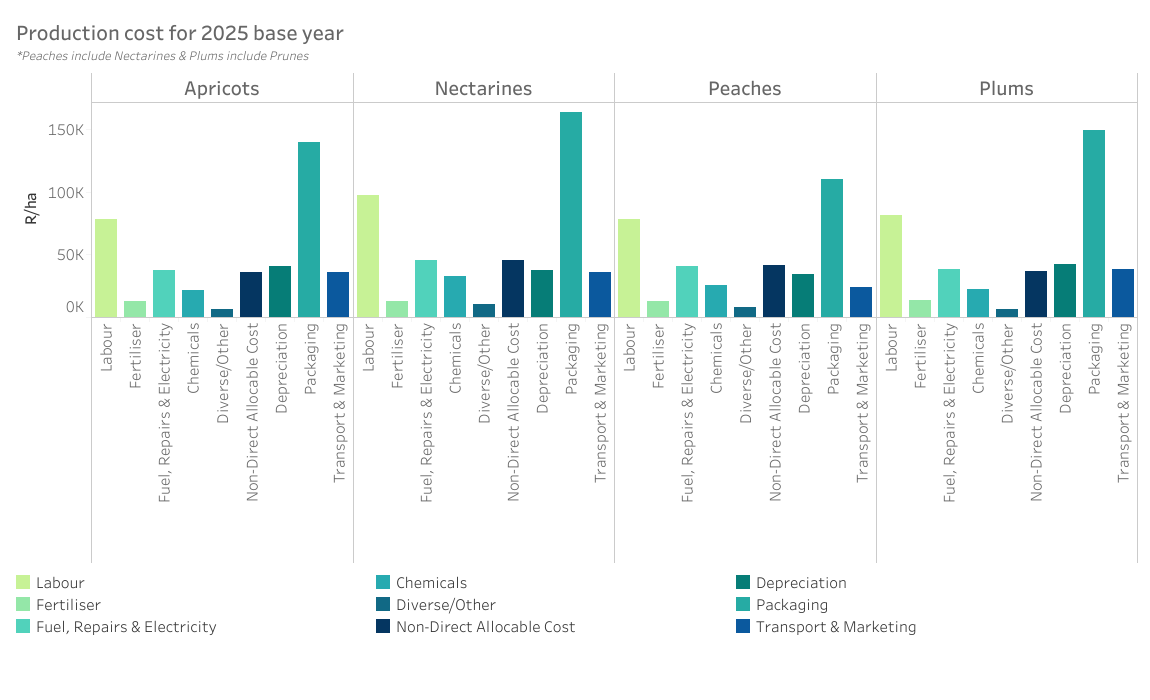
The annual cost of production on one hectare of stone fruit in this specific region is given here and is broken down to its direct and non-direct allocable cost components.
Production cost per ha (detailed)
Income
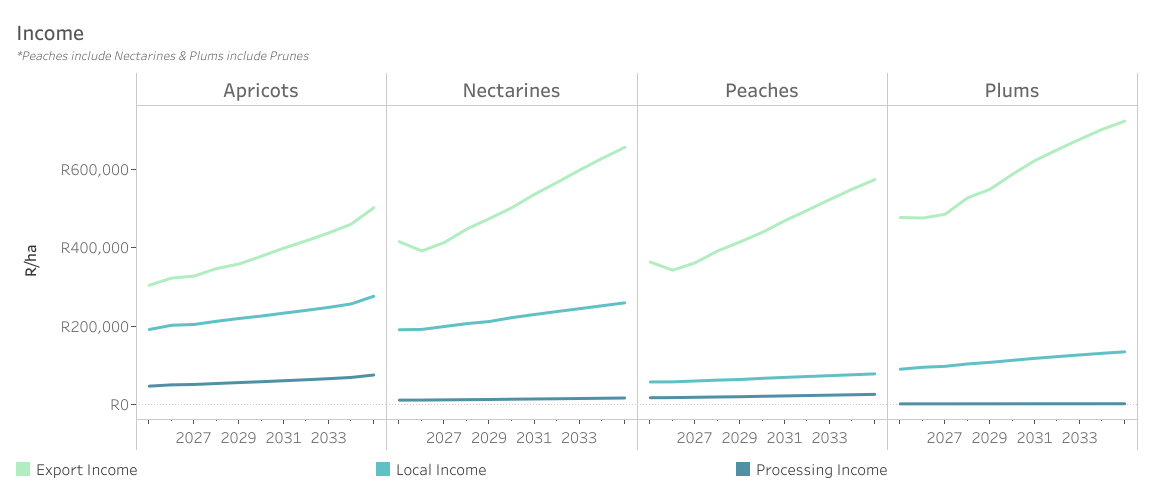
Nominal price increases projected for the industry average output prices across all market outlets (Rand/tonne), along with average yield increases over the long term, translate to increased income per hectare on farm-level. If the projections are considered for a full-bearing production unit, the higher yields then lead to higher revenue per hectare than if replacement of older orchards is done on farm-level (if assumed that the older orchards left in the ground does not deteriorate in terms of yield and marketability of the specific cultivar). Macro-economic factors such as the challenges experienced in overseas markets with regards to consumer buying power and freight cost increases, that are still higher than historic levels (pre-pandemic), are expected to put some pressure on output prices and thus farm-level revenue for the medium term (i.e., revenue per hectare will probably not be what it could have been if these factors were not present). However, the positive effects on output prices such as the weakening of the rand and improved marketing opportunities are expected to lead to improved revenue per hectare over the long term. Revenue for exports were calculated on a FOB level, and thus FOB costs are included when calculating profitability, while the revenue of domestic outlets (for fresh and processing) are calculated as the revenue received when selling to the local market (with the appropriate costs subtracted from there for profitability calculations). For farm-level revenue calculations, the regional differences were also considered in terms of yield and potential output prices. These differences originate predominantly from differences in climate, cultivars and timing in the market.
High-level Income Statement
Median EBITA R/ha for Stone fruit
Given the cost and output assumptions of the deterministic model, certain key output variables (KOVs) are made stochastic by including randomness in the outlook of these variables, within a certain band typified by their historic values. With these stochastic variables, simulations are run of each farm model to give a 500-iteration range of probable profitability outcomes. These values correspond to the figure below at an earlier step in the process (EBITA instead of Return on Establishment Cost) and provides and a projection for the medians* of the bottom third, middle- and top third of all outcomes. The probability of negative returns projected in the figure below is strongly linked to a) the base year’s performance (yields, pack-out, prices, and relative cost of production), and b) the commodity split per region. A more diversified portfolio often has a mitigating effect in terms of the change in the average returns, but an essential component of said portfolio is a high revenue generating base. The median* bottom third remains negative or low, and fairly consistent, throughout the outlook period. In comparison, in nominal terms, an improvement in the middle third is projected over the second part of the outlook. The more pronounced improvement in the top third is indicative of a slight improvement in the overall risk profile over the outlook period. This is, in our view, congruent with the changes observed in the field where producers actively work towards reducing the impact of adverse conditions on production. *Median refers to the midpoint of a data range, which is a more measured output than the extreme points, i.e., minimum and maximum, and deemed a more appropriate calculation method in this case.
EBITA/ha risk profile for Stone fruit
The simulated data of the stochastic models are further represented as a risk profile for the prototype, industry representative farm model in the region. The probabilities of achieving different levels of profitability are therefore given according to the legend given in the figure. The probability of negative returns in any given year remains – although it differs substantially between regions based on the factors highlighted above. With smaller, but intensive production units, stone fruit growers are dependent on higher returns per hectare to remain sustainable.