Pome fruit farm level planning and decision making: Witzenberg
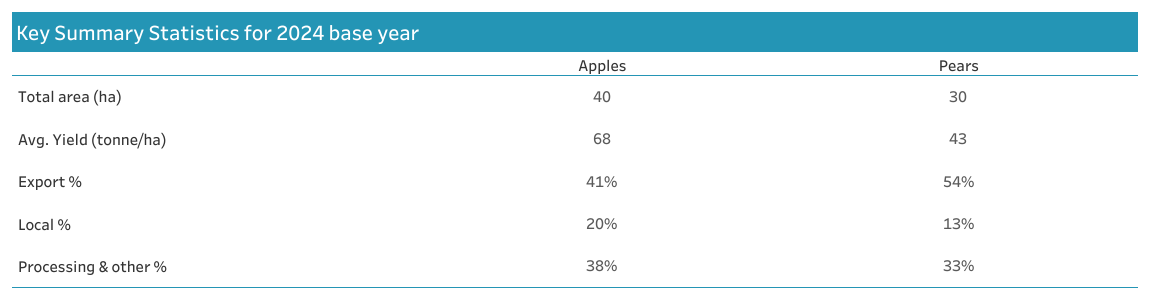
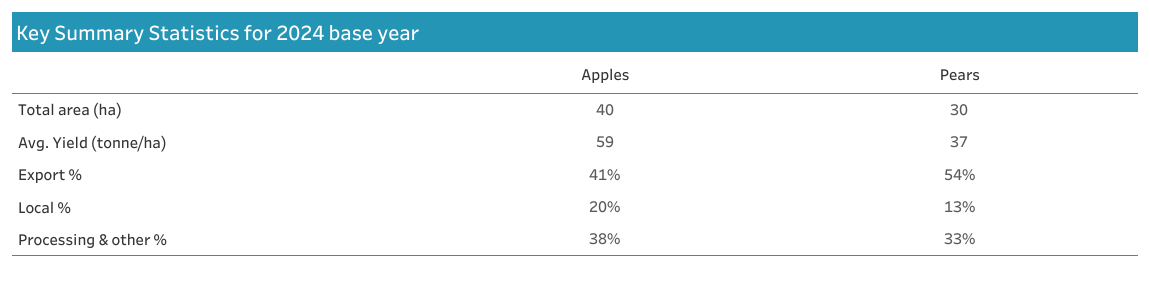
Key Summary Statistics for 2024 base year
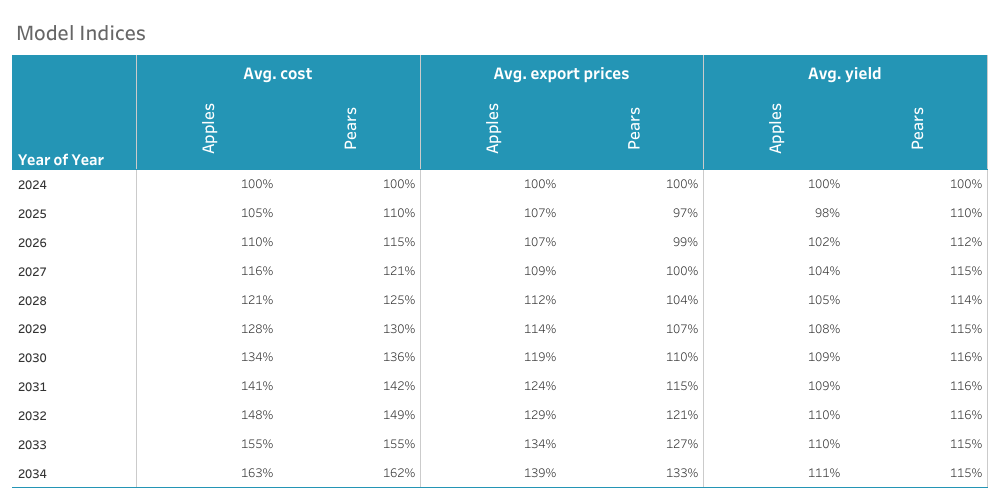
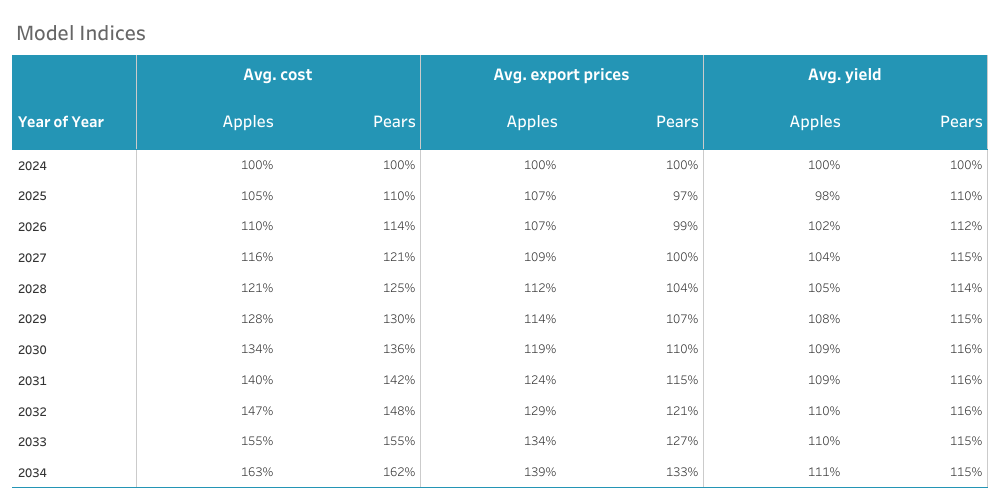
Model Indices
Market split and yield
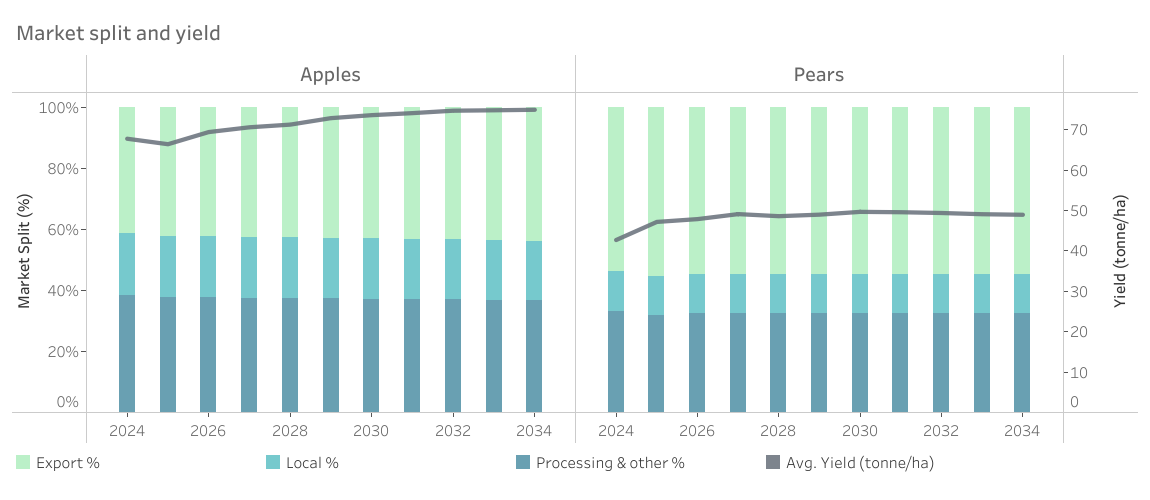
A consistent yield improvement over the outlook period is projected, barring weather related fluctuations. Whilst working towards better pack outs, the processing marketing channel remains an important outlet for pome fruit not meeting fresh packing specifications. With a fairly flat outlook for domestic sales, the expectation is that the impact of higher volumes over time would be absorbed in the processing market when not suitable for exports.
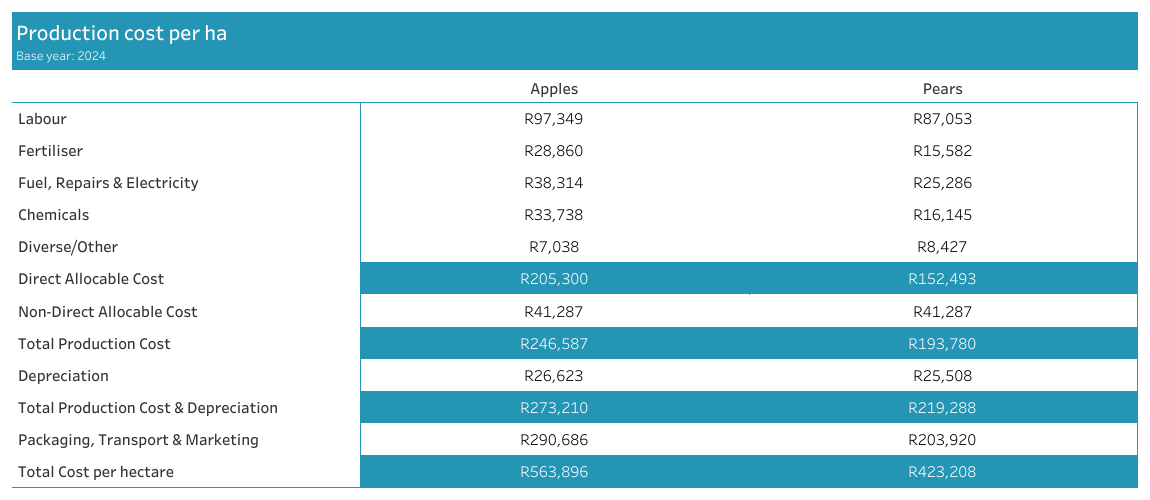
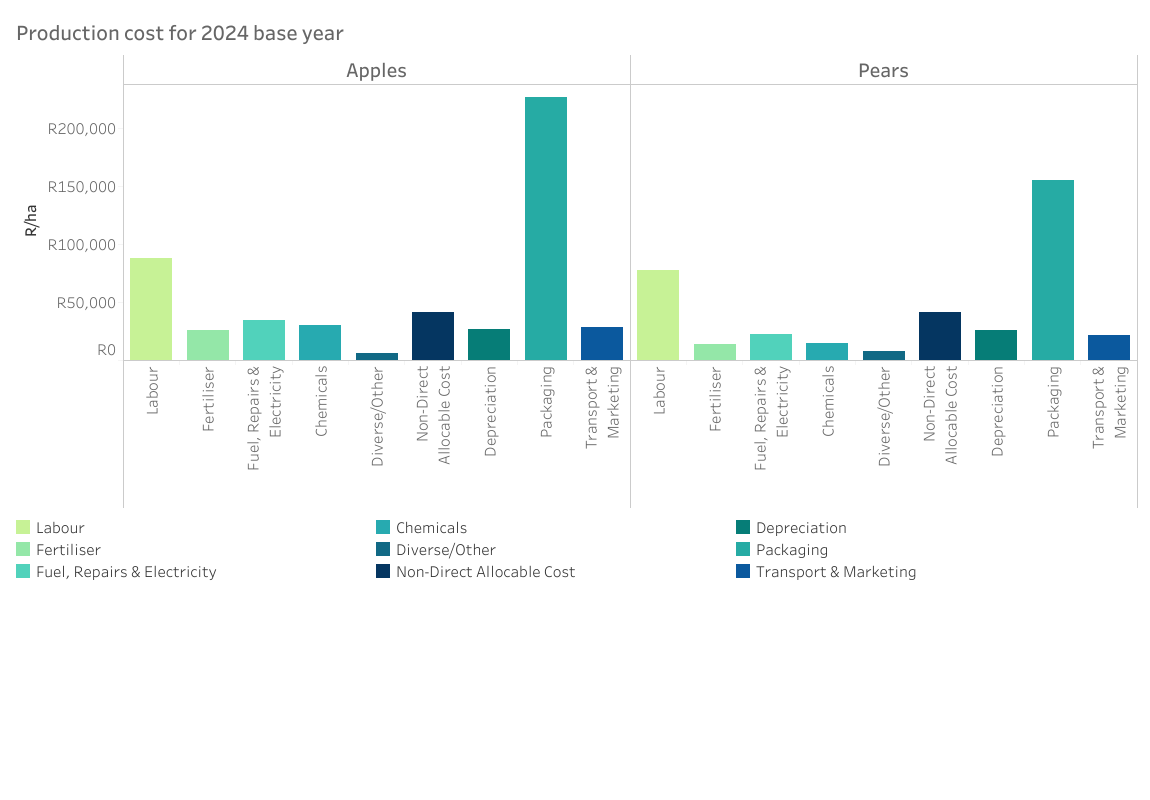
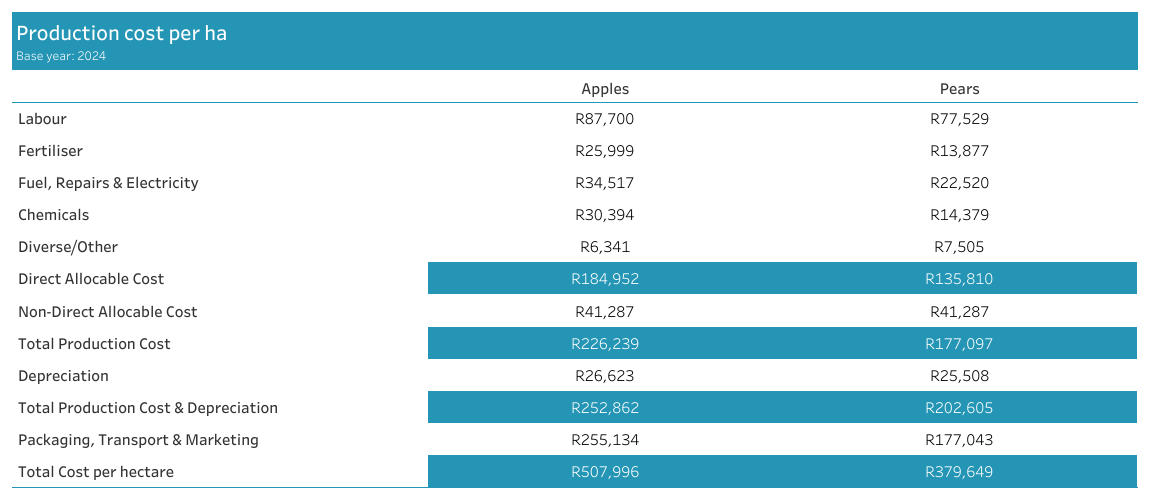
Production cost for 2024 base year
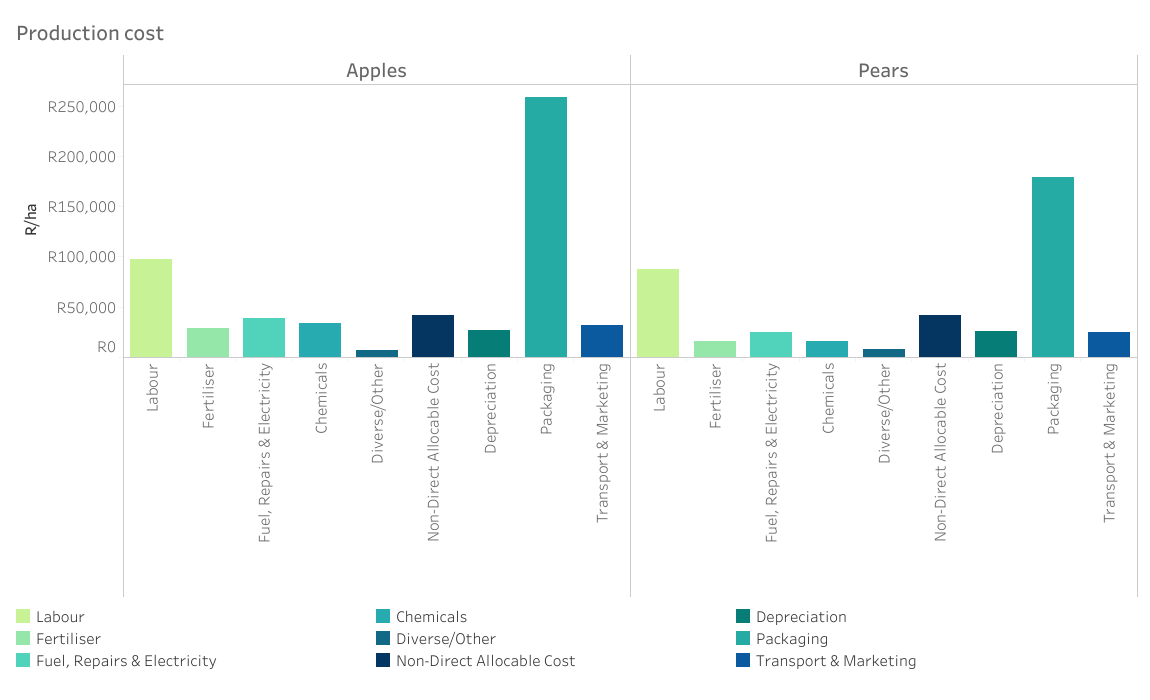
The annual cost of production on one hectare of apple and pear orchards in this specific region is given here and is broken down to its direct and non-direct allocable cost components.
Production cost per ha (detailed)
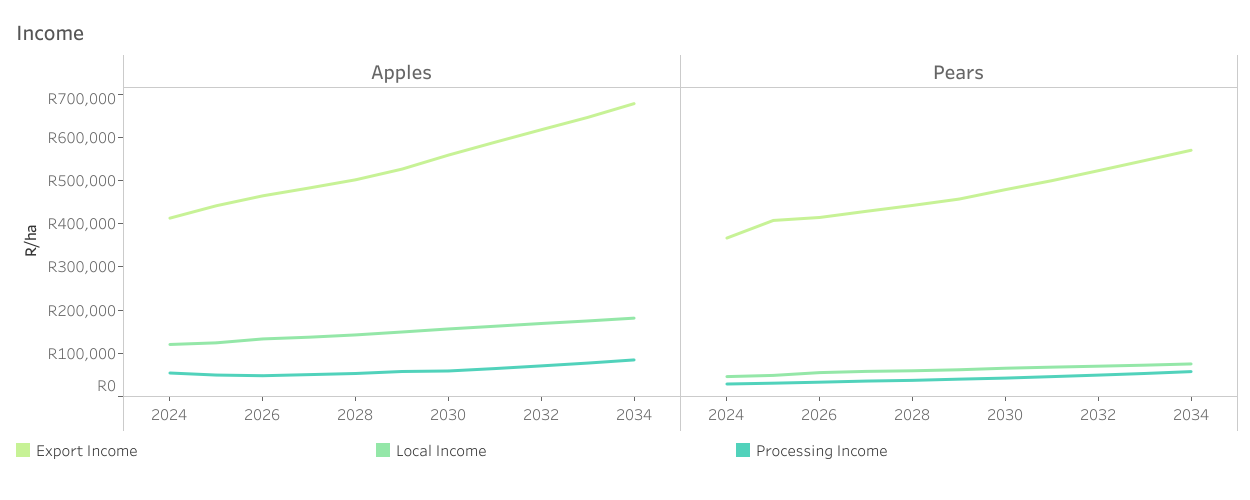
Income
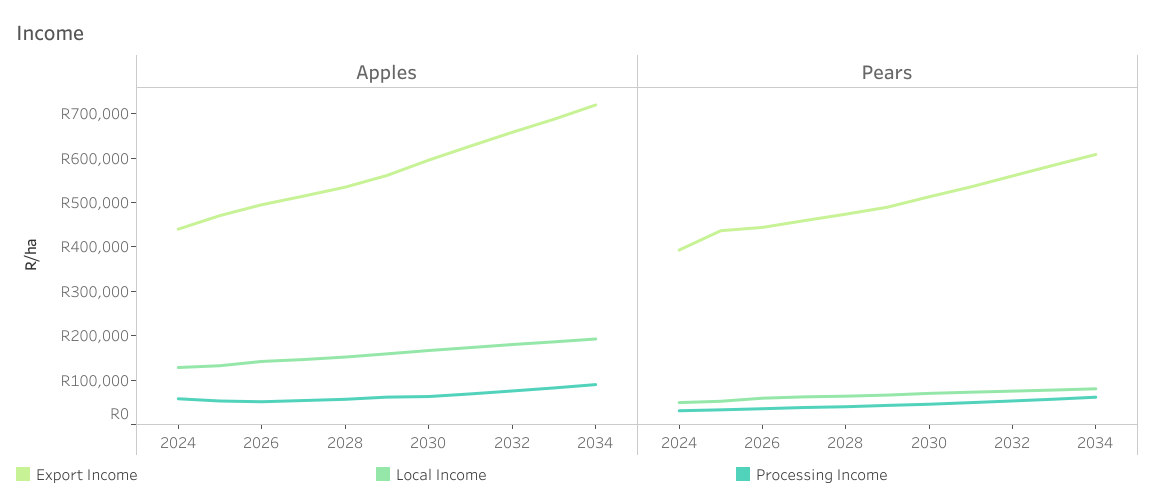
While nominal price increases are projected for the industry over the outlook period, market rebalancing in the short to medium would put pressure on revenue growth. Along with average yield increases over the long term, revenue will continue to increase per hectare on farm-level. Revenue for exports were calculated using base of net export realisation price, yield and pack-outs. The revenue of domestic outlets (for fresh and processing) is calculated as the revenue received when selling to the local market (with the appropriate costs subtracted from there for profitability calculations). For farm-level revenue calculations, the regional differences were also considered in terms of yield and potential output prices. These differences originate predominantly from differences in weather conditions (base year only), climate, cultivars, production practices and timing in the market.
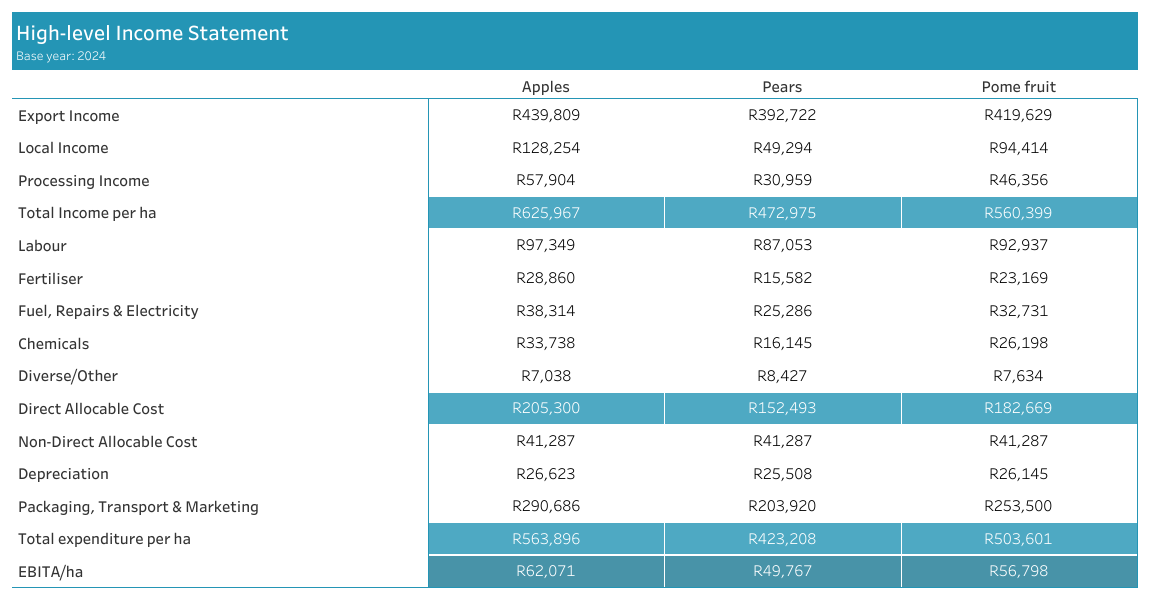
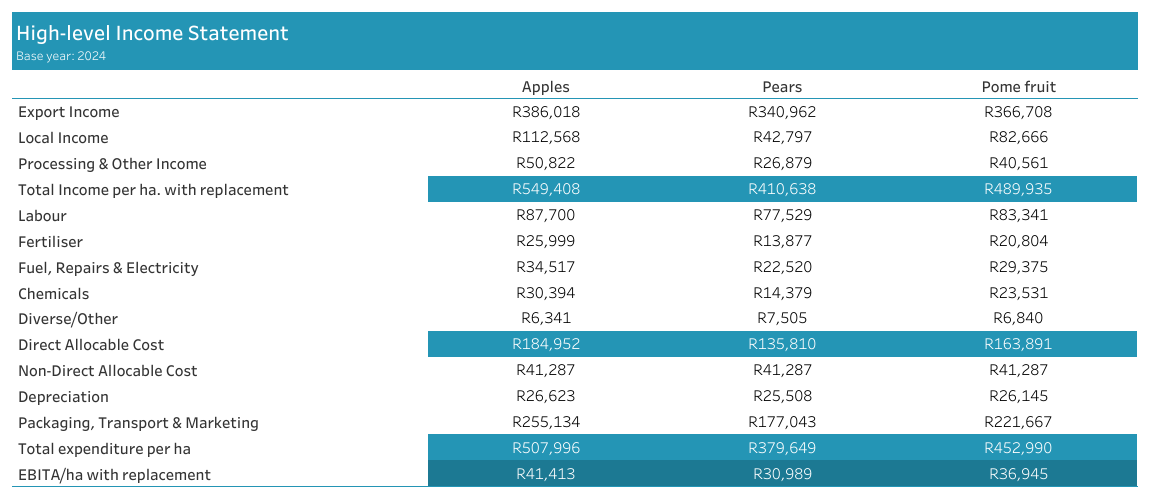
High-level Income Statement
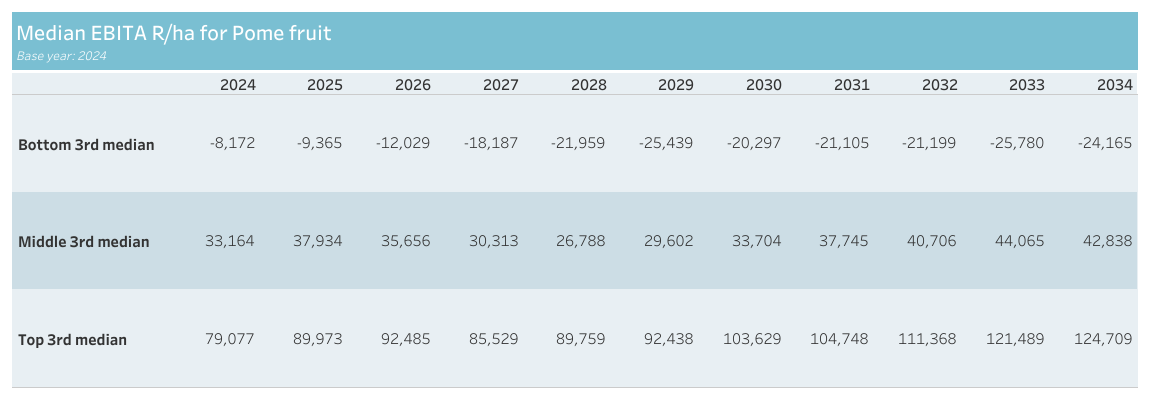
Median EBITA R/ha for Pome fruit
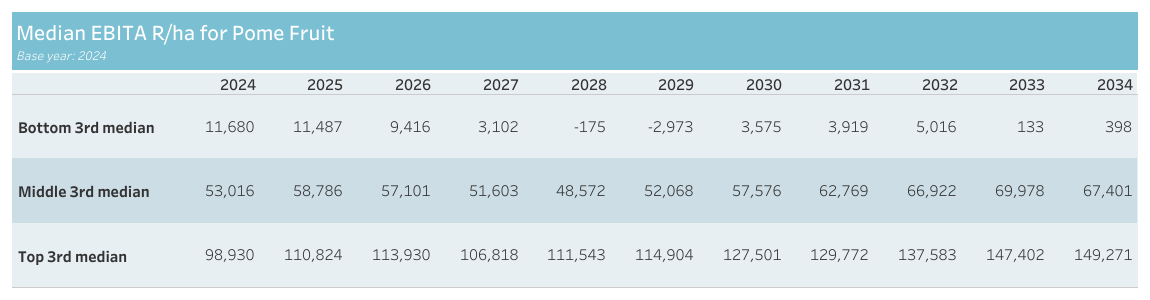
Given the cost and output assumptions of the deterministic model, certain key output variables (KOVs) are made stochastic by including randomness in the outlook of these variables, within a certain band typified by their historic values. With these stochastic variables, simulations are run of each farm model to give a 500-iteration range of probable profitability outcomes. These values correspond to the figure below at an earlier step in the process (EBITA instead of Return on Establishment Cost) and provides and a projection for the medians* of the bottom third, middle- and top third of all outcomes. Congruent with the probability of negative returns projected in the figure below, the median bottom third remains negative or very low, and fairly consistent, throughout the outlook period. In comparison, a marginal improvement in the middle third is projected. The more pronounced improvement in the top third is indicative of a slight improvement in the overall risk profile over the outlook period. This is, in our view, congruent with the changes observed in the field where producers actively work towards reducing the impact of adverse conditions on production. *Median refers to the midpoint of a data range, which is a more measured output than the extreme points, i.e., minimum and maximum, and deemed a more appropriate calculation method in this case
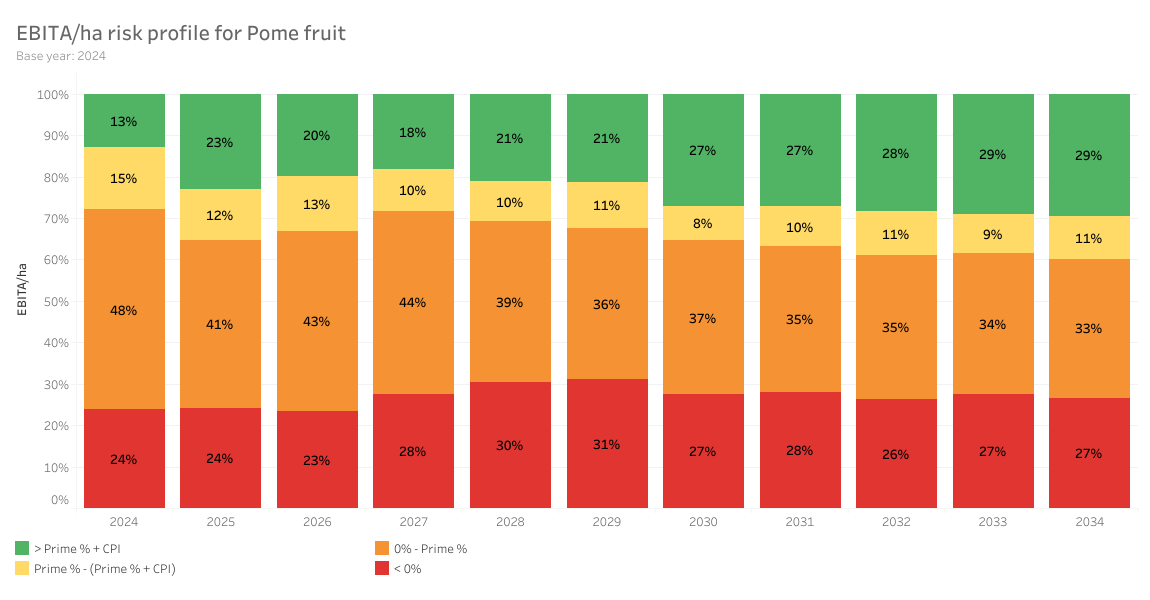
EBITA/ha risk profile for Pome fruit
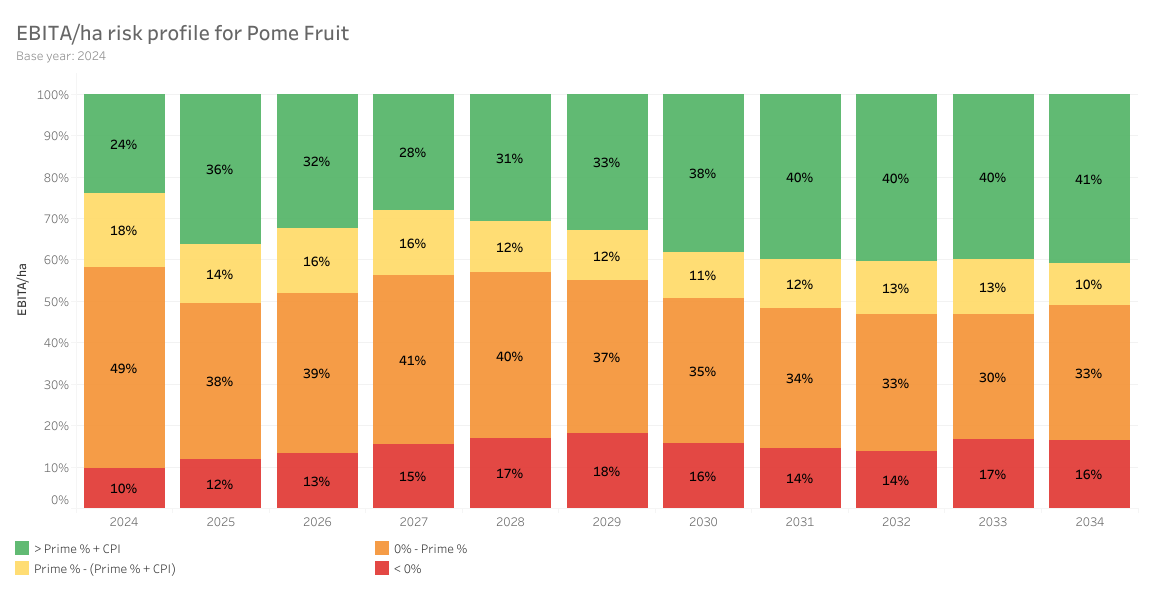
The simulated data of the stochastic models are further represented as a risk profile for the prototype, industry representative farm model in the region. The probabilities of achieving different levels of profitability are therefore given according to the legend given in the figure. The probability of negative returns in any given year remains, highlighting the risk producers face on an annual basis with exogenous factors affecting income, while cost remains high and less variable. This risk profile shows that producers are likely to face a year of negative returns 2-3 times over the course of a 10-year period.
Key Summary Statistics for 2024 base year
Model Indices
Market split and yield
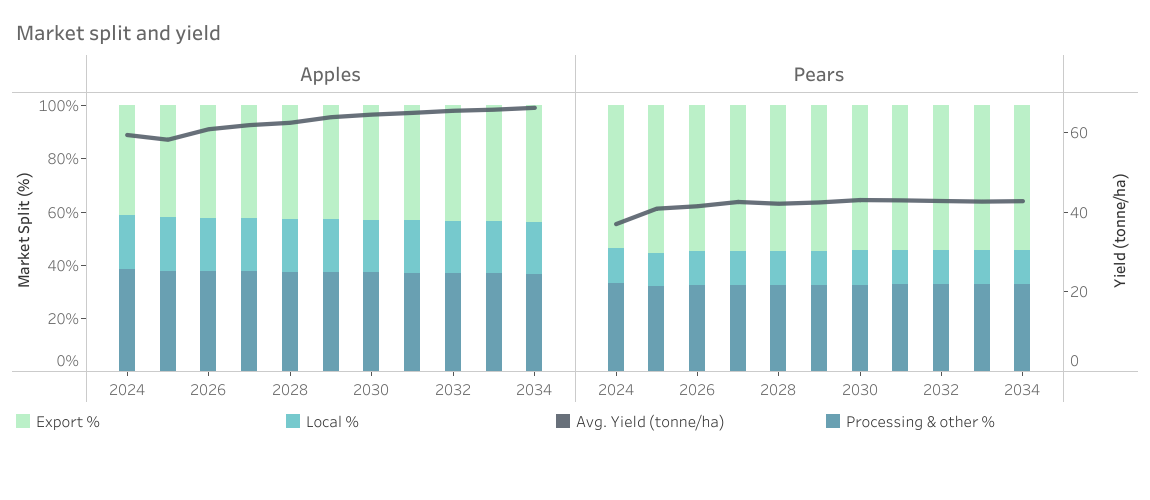
A consistent yield improvement over the outlook period is projected, barring weather related fluctuations. Whilst working towards better pack outs, the processing marketing channel remains an important outlet for pome fruit not meeting fresh packing specifications. With a fairly flat outlook for domestic sales, the expectation is that the impact of higher volumes over time would be absorbed in the processing market when not suitable for exports.
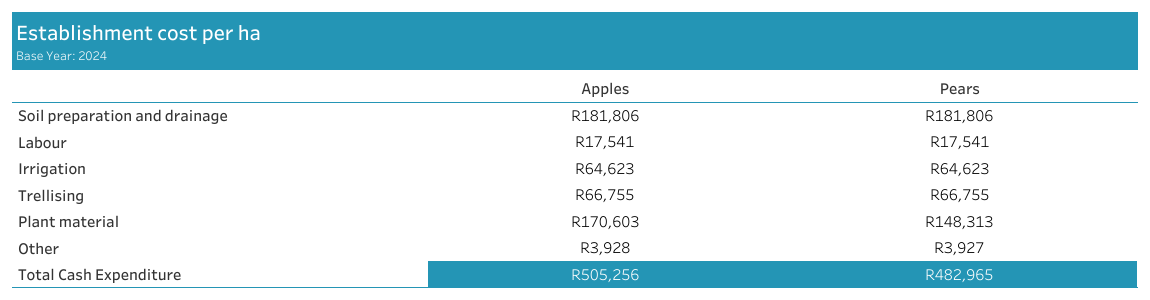
Establishment cost for 2024 base year
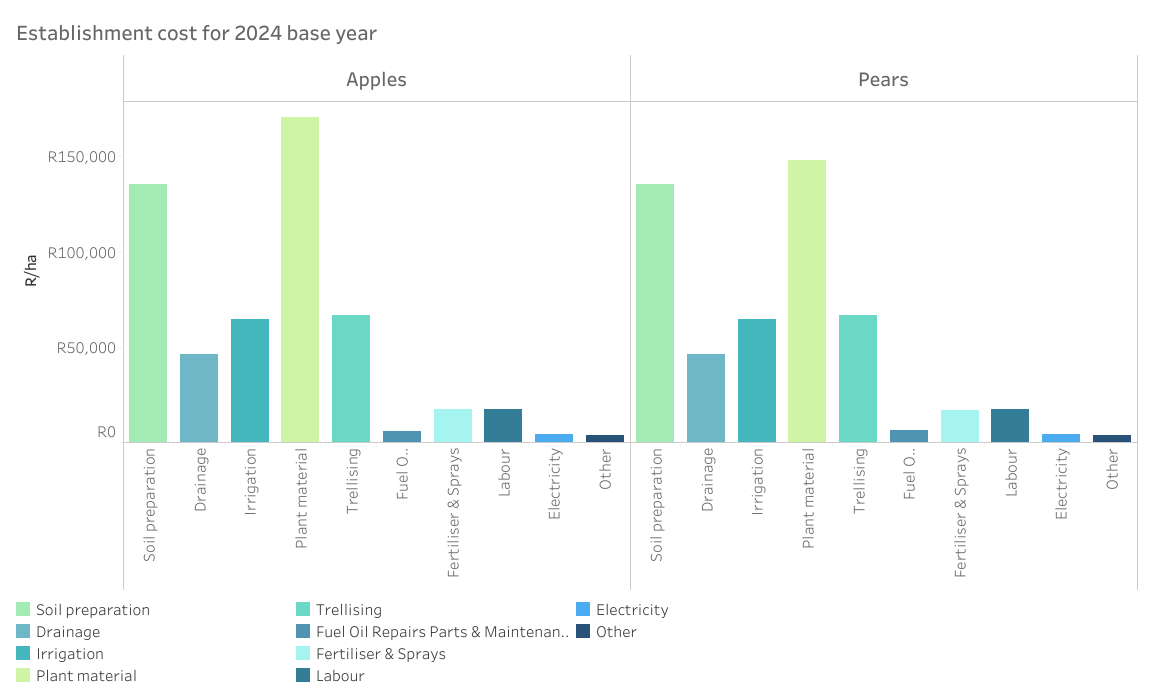
The cost of establishing one hectare of apple and pear orchards in this specific region is given here and is broken down to its direct allocable cost components.
Establishment cost per ha (detailed)
Production cost for 2024 base year
The annual cost of production on one hectare of apple and pear orchards in this specific region is given here and is broken down to its direct and non-direct allocable cost components.
Production cost per ha (detailed)
Income
While nominal price increases are projected for the industry over the outlook period, market rebalancing in the short to medium would put pressure on revenue growth. Along with average yield increases over the long term, revenue will continue to increase per hectare on farm-level. Revenue for exports were calculated using base of net export realisation price, yield and pack-outs. The revenue of domestic outlets (for fresh and processing) is calculated as the revenue received when selling to the local market (with the appropriate costs subtracted from there for profitability calculations). For farm-level revenue calculations, the regional differences were also considered in terms of yield and potential output prices. These differences originate predominantly from differences in weather conditions (base year only), climate, cultivars, production practices and timing in the market.
High-level Income Statement
Median EBITA R/ha for Pome fruit
Given the cost and output assumptions of the deterministic model, certain key output variables (KOVs) are made stochastic by including randomness in the outlook of these variables, within a certain band typified by their historic values. With these stochastic variables, simulations are run of each farm model to give a 500-iteration range of probable profitability outcomes. These values correspond to the figure below at an earlier step in the process (EBITA instead of Return on Establishment Cost) and provides and a projection for the medians* of the bottom third, middle- and top third of all outcomes. Congruent with the probability of negative returns projected in the figure below, the median bottom third remains negative or very low, and fairly consistent, throughout the outlook period. In comparison, a marginal improvement in the middle third is projected. The more pronounced improvement in the top third is indicative of a slight improvement in the overall risk profile over the outlook period. This is, in our view, congruent with the changes observed in the field where producers actively work towards reducing the impact of adverse conditions on production. *Median refers to the midpoint of a data range, which is a more measured output than the extreme points, i.e., minimum and maximum, and deemed a more appropriate calculation method in this case
EBITA/ha risk profile for Pome fruit
The simulated data of the stochastic models are further represented as a risk profile for the prototype, industry representative farm model in the region. The probabilities of achieving different levels of profitability are therefore given according to the legend given in the figure. The probability of negative returns in any given year remains, highlighting the risk producers face on an annual basis with exogenous factors affecting income, while cost remains high and less variable. This risk profile shows that producers are likely to face a year of negative returns 2-3 times over the course of a 10-year period.